
Timeline: Effects of COVID-19 on Public Library WiFi Use
We analyzed data from our library partners to understand the effects of COVID-19 on public library WiFi use. We intended to determine how, or if, the spread of COVID-19 affected public library WiFi usage and patron behavior. And if it did, how, when, and why did patron behavior change. This analysis includes all population sizes and service areas of our library partners.
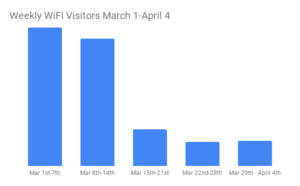
Our data shows that between the first week and last week of March, visitor usage dropped significantly, then leveled. It’s interesting to note that there has not been a rapid and steady decrease like this in the history of our reporting.
The data is from library locations that kept WiFi on even after closing the building to the public. We did not include data from libraries that didn’t continue WiFi service while closed.
The purpose of the national data analysis is to identify national trends and responses to the spread of COVID-19 and determine if particular events correlated with data changes. We used the timeline of events from NBC news to correlate our data findings with international news related to the virus.
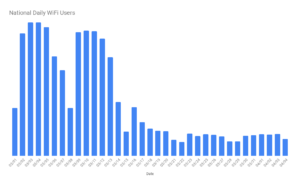
Breakdown of the Daily Changes in National WiFi Use
As you can see from the graph above, the data shows that the outbreak of COVID-19 did affect public library WiFi use. Even though 98% percent of libraries were closed by the end of March, and 81% left WiFi on. The fact that WiFi use did continue in some capacity seems to be a result of this library action. By March 28, the national library WiFi use declined by an average of 67%.
When libraries close we expect a decrease in WiFi use. But there were interesting findings in the timing of these changes. The data shows that between the first week in March and last week in March, patron WiFi usage dropped significantly, but there was still some activity. The graph below shows the biggest drop was after the week of March 8-14. When we dig even deeper, we can see changes on specific days that seem to correlate with national events. See the graph below for a detailed breakdown of the daily changes and the rapid decline of WiFi use.
WiFi Usage Correlates With Key Events
Were there key events that could have made a difference in patron behavior and WiFi use? Based on our data and national timeline of events, it seems so. The graph above shows a sharp decline in WiFi use beginning March 11 with the sharpest declines occurring on March 13th, 14th, and 15th. March 11th was the day the NBA suspended its season after a Utah Jazz player tested positive for coronavirus, and also the day that Tom Hanks and Rita Wilson tested positive. March 12th was the day that MLB, NHL, and NCAA basketball announced suspension or pause of their events. Then, on March 13th, President Trump declared a national state of emergency. At this point, many local governments issued shelter-in-place orders, effectively closing many library locations.
As always, correlation does not equal causation. It’s unclear if these national events were the cause, a tipping point, or a random occurrence that correlated with the data. In either case, it is clear that a trend change to a “new normal” occurred between the days of March 11th and March 15th.
Official ALA Recommendations
On March 17, The ALA officially recommends closing libraries to the public. Then on March 23, the ALA officially recommends libraries leave WiFi on. Again, whether these recommendations caused a decrease in WiFi usage or were in response to the drop is unclear.
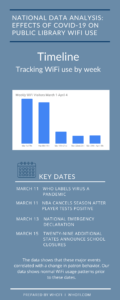
Timeline of Events
The data shows these major events correlated with a change in patron WiFi use.
- March 11 The World Health Organization declared that the coronavirus outbreak “can be characterized as a pandemic,” which is defined as the worldwide spread of a new disease for which most people do not have immunity.
- March 11 The NBA suspended all basketball games after a player for the Utah Jazz preliminarily tested positive for COVID-19.
- March 13 President Trump declares a national state of emergency.
- March 15 Twenty-nine additional states announce school closures.
Interestingly, prior national events related to the COVID-19 pandemic didn’t correlate with a decrease in library WiFi use.
- January 22 The first travel-related confirmed COVID-19 case was documented.
- February 24 The U.S. stock market crashed over coronavirus fears after the Dow Jones Industrial Average experienced the worst day in two years.
- February 26 The first case of suspected local transmission was recorded.
Even after the ALA officially recommended closing libraries to the public, patrons were accessing the WiFi. Though, some variables affect the numbers such as how quickly libraries closed after this official recommendation or if they closed at all. There were also differences when comparing data from rural and urban libraries, which we’ll do later in the next report.
Data highlights the importance of public libraries in communities.
Libraries have adapted and expanded services to meet community needs. Many libraries created ‘drive-in WiFi’ hotspots to meet the needs of the community. This could be why the WiFi usage numbers have remained relatively steady after the decline from March 11 through the 15th. Tracking this could prove to be beneficial in future library advocacy efforts. In our next blog, we’ll compare the data for urban and rural service populations.
1. According to data from the PLA Survey and Response to COVID-19.