
When analyzing WiFi insights data and looking for usage trends over the past year, we’ve identified clear fluctuations in use that seem to correlate with particular service areas, important timelines in the pandemic, and/or library outreach efforts. As we look at the data for Q3, there are some interesting changes to these numbers, along with a steady increase in WiFi usage across service areas.
The COVID-19 pandemic certainly brought about many changes in the way patrons interact with their libraries and how libraries serve their communities. These changes seem to be contributing to the WiFi usage trends, as many libraries have extended their WiFi services by leaving it on 24/7 and creating stronger signals for patrons who use WiFi in the parking lot.
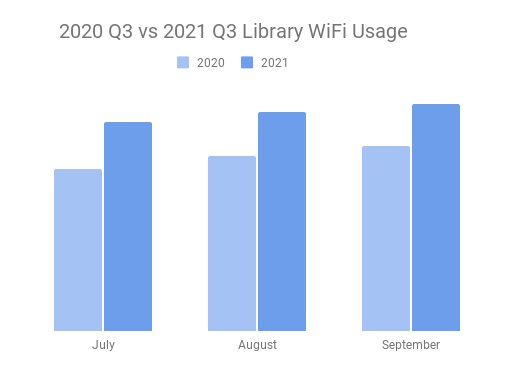
What does WiFi usage look like compared to Q3 of 2020? In 2021, there continues to be a steady increase and at a much higher usage rate which means more patrons are using the WiFi this year.
The following graph shows the comparison between 2020 and 2021.
Why are more people using the library’s WiFi now?
In our last report we noted that there was a new higher WiFi usage trend that appeared to start in March 2021 and continued through Q3. This could be related to vaccinations being deployed, reopenings, and warmer weather. Historically, libraries have had higher WiFi usage in warmer weather, and this is true this year. The charts below show the increase in WiFi usage during the middle of the summer while school is out, and it tapers off a bit in late summer/early fall as school is starting up again. Even with a slight monthly dip in Q3 2021, the numbers are still higher than compared to Q3 2020.
The chart below shows just how much of an increase year over year there’s been.
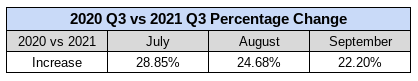
The urban populations have seen a much higher percentage increase in WiFi use for Q3 than rural areas. This could be attributed to the fact that rural areas had already regained their usage rates and urban areas are now catching up as the need increases, and seasonality, as mentioned above.
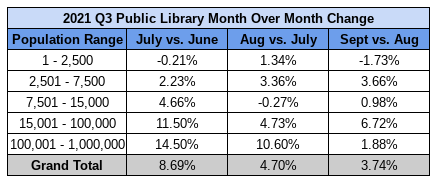
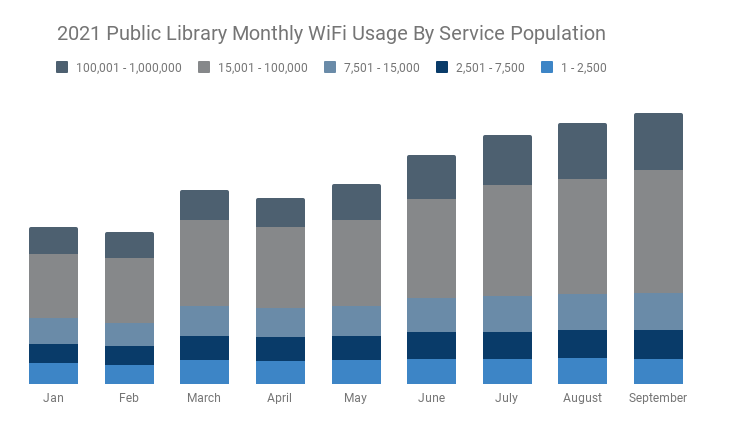
The chart below shows a significant increase in July vs. June for the 15,000 – 100,000 and 100,001 – 1,000,000 populations sizes. Then a slower increase in the following months. Notably, the 7,501 – 15,000 population size showed the most fluctuation month to month in Q3, which also happened during Q2.
The chart below shows the change in WiFi usage during Q3 based on population size.
Weekly and monthly usage
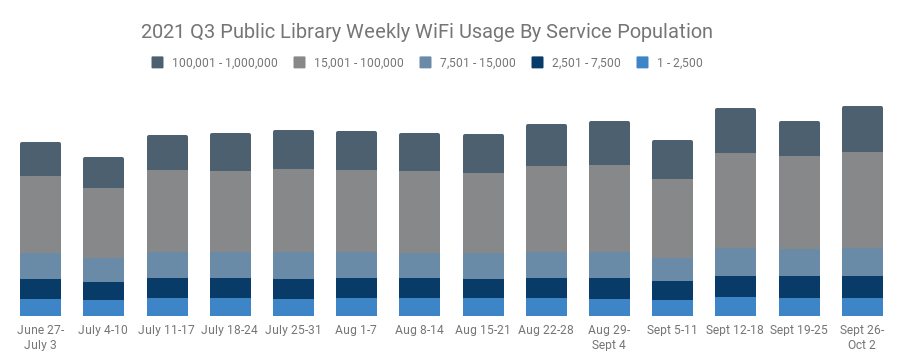
Looking at WiFi usage trends on a weekly and monthly basis provides insight into exact times when patron behavior changed and if it correlates with any particular event. You’ll see the usage rates were mostly steady, with a couple of decreases in early July and September. These decreases correspond with the July 4th and Labor Day holidays.
The graph below shows the national week by week Q3 WiFi usage.
The graph below shows the month over month changes in 2021. You’ll notice just how much of an increase there’s been overall in 2021.
What does this mean for these libraries and how can they best serve their community going forward?
The data is clear: WiFi is a valuable resource the libraries offer to help their communities. As libraries begin to prepare for the year ahead and planning for the future, tracking WiFi usage could prove beneficial for library advocacy efforts, operational improvements, strategic planning, and accurate reporting for the PLS survey. Having such information can give libraries the tools they need to secure funding to provide more and better services, and even help guide decisions on how to best use their space.
Carrying insights into the future.
This data solidifies the importance of public libraries within the communities they serve. Even before the coronavirus outbreak, lack of internet access was a big problem – now it’s critical. Throughout the pandemic, public libraries have continued to help patrons stay connected to school, work, and family. In addition, they continue to help provide social service assistance for their community members through filing for unemployment, Census registration, and job searches.
The knowledge we’ve gained from WiFi insights will continue to influence how libraries interact with the communities they serve.