
When analyzing WiFi insights data and looking for usage trends over the past year, we’ve identified clear fluctuations in use that seem to correlate with particular service areas, important timelines in the pandemic, and/or library outreach efforts. As we look at the data for Q2, there are some interesting changes to these numbers, along with a steady increase in WiFi usage across service areas.
The COVID-19 pandemic certainly brought about many changes in the way patrons interact with their libraries and how libraries serve their communities. These changes seem to be contributing to the WiFi usage trends, as many libraries have extended their WiFi services by leaving it on 24/7 and creating stronger signals for patrons who use WiFi in the parking lot.
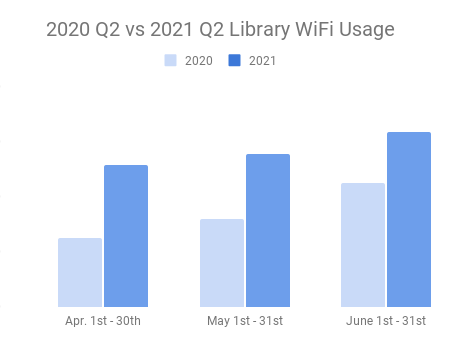
What does WiFi usage look like compared to Q2 of 2020? Interestingly, the overall trends month by month show similar growth. In 2020, there was a sharp decline in usage in March, then there was a steady increase after that. In 2021, there continues to be a steady increase and at a much higher usage rate which means more patrons are using the WiFi this year.
The following graph shows the comparison between 2020 and 2021.
Why are more people using the library’s WiFi now?
In our last report we noted that there was a new higher WiFi usage trend that appeared to start in March 2021 and continued through Q2. This could be related to vaccinations being deployed, reopenings, and warmer weather. Historically, libraries have had higher WiFi usage in warmer weather, and this is true this year. The children’s programming during summer months typically attracts more patrons than usual since school is out. One thing is clear and it’s that the community needs the public library’s WiFi and is showing up to use it and the services provided in the space.
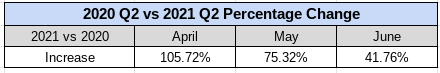
The chart below shows just how much of an increase year over year there’s been.
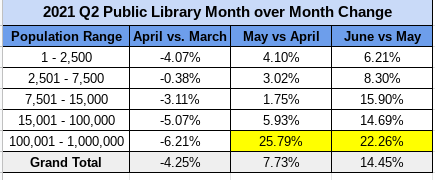
In previous reports, our data showed that library WiFi use in both urban and rural service areas decreased, but urban areas had a much greater drop. And throughout the pandemic libraries in rural areas had a much faster return to pre-pandemic WiFi usage rates compared to libraries in urban areas.
The urban populations have seen a much higher percentage increase in WiFi use for Q2 than rural areas. This could be attributed to the fact that rural areas had already regained their usage rates and urban areas are now catching up as the need increases, and seasonality, as mentioned above.
The chart below shows the change in WiFi usage during Q2 based on population size.
Weekly and monthly usage
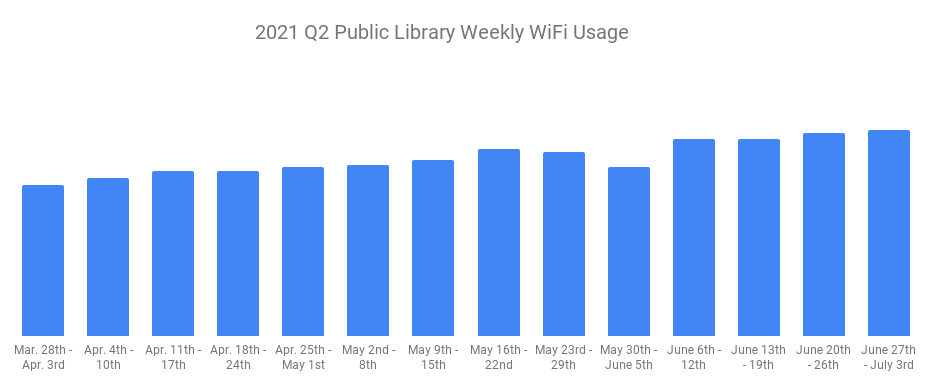
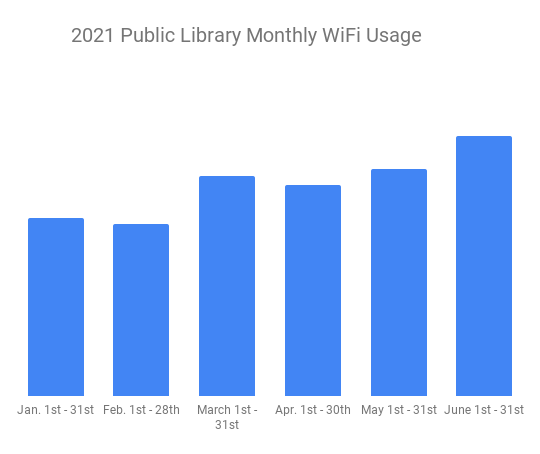
Looking at WiFi usage trends on a weekly and monthly basis provides insight into exact times when patron behavior changed and if it correlates with any particular event. You’ll see a steady increase every week this quarter in usage. There was a dip during the Memorial Day holiday, as expected. Month over month you’ll see a large spike in March with a small dip in April, then continued increased usage every month through the quarter.
The graphs below show the national week by week and monthly Q2 WiFi usage.
What does this mean for these libraries and how can they best serve their community going forward?
The data is clear: WiFi is a valuable resource the libraries offer to help their communities. As libraries begin to prepare for the year ahead and planning for the future, tracking WiFi usage could prove beneficial for library advocacy efforts, operational improvements, strategic planning, and accurate reporting for the PLS survey. Having such information can give libraries the tools they need to secure funding to provide more and better services, and even help guide decisions on how to best use their space.
Carrying insights into the future.
This data solidifies the importance of public libraries within the communities they serve. Even before the coronavirus outbreak, lack of internet access was a big problem – now it’s critical. Throughout the pandemic, public libraries have continued to help patrons stay connected to school, work, and family. In addition, they continue to help provide social service assistance for their community members through filing for unemployment, Census registration, and job searches.
The knowledge we’ve gained from WiFi insights will continue to influence how libraries interact with the communities they serve.
Questions about how to get insights for your library? Schedule a demo with our team.