Urban and Rural Comparison Analysis: Effects of COVID-19 on Public Library WiFi Use
As we set out to gather data on the library WiFi usage numbers amid the COVID-19 health crisis, we analyzed the effects of COVID-19 on public library WiFi use in urban and rural areas. We wanted to know the effects of COVID-19 on public library WiFi use by population size. For this comparison, we consolidated data from our library partners to identify trends in service areas based on population size. We want to know if library WiFi usage changed by population size and if so by how much. Did changes mirror the national data and timeline? The purpose of urban vs. rural comparison is to see if population size made a difference in WiFi usage.
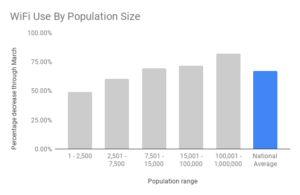
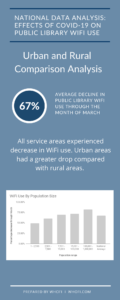
Our data shows that library WiFi use in both urban and rural populations showed a decrease, but urban areas had a much greater drop.
| US Public Library WiFi Visitors Weekly Change by Population | ||
| Population Range | Week of March 22nd-28th | Week of March 29th-Apr 4th |
| 1 – 2,500 | -49.00% | -46.65% |
| 2,501 – 7,500 | -60.38% | -62.20% |
| 7,501 – 15,000 | -69.25% | -67.92% |
| 15,001 – 100,000 | -71.46% | -71.78% |
| 100,001 – 1,000,000 | -81.87% | -81.81% |
| National Average | -67.02% | -66.66% |
Rural areas did show a decrease in WiFi use, however, the decrease wasn’t as dramatic as in urban areas. The percentage of decrease correlates with the population size. The chart above shows that the larger the population, the greater the decrease in WiFi use.
Library Service Area Size and Patron WiFi Needs
It is difficult to determine exactly why the data shows a difference in the effects of COVID-19 on public library wifi use by population size. From conversations, we’ve heard that a variety of social, cultural, and economic factors contribute to these numbers. Variables such as transportation, other means of accessing the internet, climate, and when local governments declared shelter-in-place orders influence these numbers. Another variable could be when and if libraries moved routers closer to windows to make drive-in WiFi access easier. Librarians in respective service areas can use this data. These numbers combined with local knowledge can shine a light on the community needs which can influence advocacy and funding. For more information about our data related to COVID-19 and WiFi use, check out our previous blogs.


